.png#/media/File:Price-Earnings_Ratios_as_a_Predictor_of_Twenty-Year_Returns_(Shiller_Data).png)
"Price-Earnings Ratios as a Predictor of Twenty-Year Returns (Shiller Data)" - Inspired by a figure from Shiller's book Irrational Exuberance. Licensed under GFDL via Wikimedia Commons.
One can invest wisely by following only a few simple rules. This article summarizes several of these, but it also offers a perspective contrary to the commonly held belief that years until planned retirement should be the primary determinant of the percentage of stocks in one's portfolio.
The conventional wisdom about investment that I have heard from multiple sources has included many principles that I agree with:
My father, a retired banker, taught me to reject one piece of the conventional wisdom, however. That piece is generally stated in a manner similar to the following:
Since WWII, stocks have given a dramatically better total return than bonds if bought and held for the long term. However, stock values are subject to much wider price fluctuations than bonds. Therefore, young people investing for retirement should invest the majority of their portfolios in equities (stocks) and, as they age, they should gradually shift the proportion of their investments to bonds so that they can avoid the potential scenario that, when they need access to their savings, the value has decreased dramatically, causing them to spend a greater percentage of their savings in a year than they have planned for.
While I agree that historical data since WWII have supported this approach, I have run simulations for such a retirement strategy during the period for 1870-1940 and have found it to have an alarmingly poor returns - certainly far too low for me to suggest that a young person trust the retirement strategy of investing a high proportion of his or her portfolio in stocks at a time such as now when stocks are overpriced. Furthermore, should you live many more decades than you anticipate, your portfolio might not be grow sufficiently to begin to make up any shortfall if you have converted it entirely to bonds. I will present the alternative perspective that I prefer below in the section Threshold-Based Equity Allocation - A Perspective, which is at least a bit more protective against downside risk of the stock market to total return of the investment portfolio.
Total return on in investment is the sum of all interest or dividends received plus the change in the value of the principal.
As inflation occurs, you can buy fewer goods or services for a dollar. To account for this, the terminology "real return" was coined to refer to return on an investment after accounting for the effect of inflation. Consequently, even an investment that has a positive total return can have a negative "real" return if the loss in buying power is greater than the total return of the investment "on paper".
Money market funds invest in "commercial paper" and CDs that "mature" (are repaid) over very short periods. Consequently, they are virtually unaffected by the interest rates for bonds, i.e., their principal value varies very little if at all (typically, not at all). The price that investors pay for this stability is that they offer very little real return, especially after accounting for taxes on interest. They are a safe place to park your money, but not a way to make it grow; indeed, inflation may shrink it.
Bond prices are strictly driven by the term and interest rate, and the latter is in turn driven by risk that a bond will not be repaid. Since interest rates do not vary rapidly, the value of your invested principal varies only slowly; bonds can offer moderate real return. Care is necessary to be sure that you buy bonds that are not unfavorably affected by interest rates, e.g., when interest rates are low, it is unfavorable to buy long-term bonds or "inflation protected" bonds (both of which will lose value dramatically when interest rates rise). There is a formula to allocate between short and long term bonds presented in the section Cash and Bond Allocation Based on 10 Yr T-Bill below.
Buying bonds directly requires a broker and a great deal more effort than the casual investor probably is prepared to make. By contrast, mutual bond index funds make it easy to incorporate bonds into a portfolio.
Buying a stock is buying part of a company. Ultimately, one invests in a for-profit company to make profit; the ability to make profit forms the basis for financially valuating a company (although, of course, companies can provide value to a community beyond their capability of making a profit, e.g., through providing good jobs or charitable support). Beyond profitability, however, many more factors influence how much investors may be willing to pay for a stock, such as their belief in the overall economy's ability to support corporate profitability, concerns over interest rates, concerns over national security or the threat of war, availability and prices of commodities (such as oil), the belief that the market will continue to boom without much risk for a downturn (at least for the foreseeable future), or even factors unlikely to have dramatic impact on corporate profits such as expected election outcomes. Thus, even if a market tends toward "efficiency" (i.e., where the price of a company's stock primarily reflects the company's ability to make a profit), the price of a company's stock may undergo giant fluctuations driven by the moods of investors.
Asset allocation is distribution of investments among the three asset classes in an attempt to minimize downside risk while maximizing opportunity for a positive real return.
Robert J. Schiller's book Irrational Exuberance by Nobel laureate Robert J. Schiller illustrates our tendency to ignore downside risk when all is going well. Whether we are talking about the average price of a stock in an index, the value of a home, or even the price of tulips, when we see a continual upward trend in the price that others are willing to pay for a commodity, we begin to expect that that trend to continue and thus to believe that investment in that commodity is more likely to result in a gain than a loss. The book details several examples to the contrary, where "bubbles" in the price of a commodity burst when the perceived valuation of that commodity deflated to a more objective one.
A realistically priced investment is priced according to its expected total return. Unless there is very significant cause to believe that a stock will increase in price, its earnings are the measure of what its most reasonable price would be. However, enthusiasm or pessimism can drastically influence the willingness of the market to pay a different price for the stock. Schiller assesses the overvaluation or undervaluation of the S&P 500 stock index using what he terms the "Cyclically Adjusted Price to Earnings Ratio" (or "CAPE"), which reduces the effect of economic cycles on stock valuation by considering the ratio of a stock's current price to one tenth of its total earnings over the previous ten years. A common name for the CAPE is Shiller's PE10, which is so named to contrast it with the more commonly used and more cyclically affected Price to Earnings Ratio, or "PE". Another common name is the "Shiller PE".
Shiller showed that, for long term investing, the total return for the S&P 500 (dividends plus stock price) over the ensuing 20 years generally decreased as the PE10 increased.
"Price-Earnings Ratios as a Predictor of Twenty-Year Returns (Shiller Data)" - Inspired by a figure from Shiller's book Irrational Exuberance. Licensed under GFDL via Wikimedia Commons.
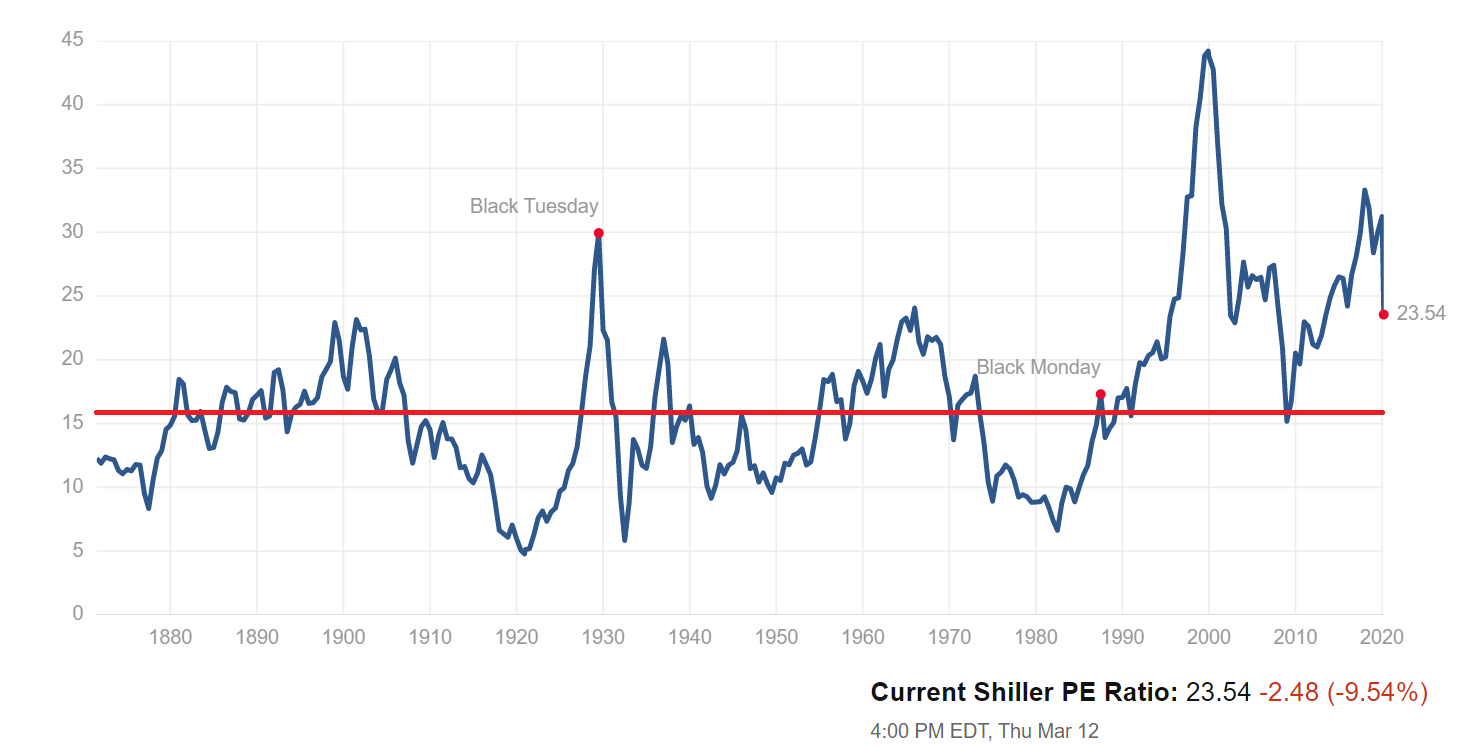
My perspective on this is that, if I am investing for the long term, then history tells me that I should assume that, over the long term, that the PE10 is most likely to return to the median PE10, which is about 15.8. There's a very handy graph of the history of the PE10 at http://www.multpl.com/shiller-pe. Here is a snapshot of how this graph appeared on 12 March 2020 (I added a red line at about 15.8 to demonstrate when the PE10 was above and below the median):
As of this writing, the PE10 is at about 33.66, meaning that, if the PE10 were to return to its median value (i.e., the long-term expectation of its value), then an investment in the S&P 500 would lose about 51% of its value (33.7 - 15.8)/33.7 = 51%.
My approach current approach is as follows:
The following table shows the buy and sell thresholds based on the rules above, i.e., the limits for percentage of equities (stocks) in a portfolio versus the PE10. For example:
To recalculate the thresholds but with expected loss limits different from 7% and 10%, you can:
PE10
S&P 500 price
10-yr avg. earningsBUY
equities up to
minimum
% of portfolioSELL
equities down to
maximum
% of portfolioExpected
risk to
portfolio
value13.0 85.0% 13.5 85.0% 14.0 85.0% 14.5 85.0% 15.0 85.0% 15.5 85.0% 16.0 85.0% 0.0% 16.5 85.0% 3.0% 17.0 85.0% 5.9% 17.5 81.7% 8.6% 18.0 63.0% 85.0% 11.1% 18.5 51.8% 74.0% 13.5% 19.0 63.3% 15.8% 19.5 55.7% 17.9% 20.0 50.0% 20.0% 20.5 45.6% 22.0% 21.0 42.0% 23.8% 21.5 39.1% 25.6% 22.0 36.7% 27.3% 22.5 34.6% 28.9% 23.0 32.9% 30.4% 23.5 31.3% 31.9% 24.0 30.0% 33.3% 24.5 28.8% 34.7% 25.0 27.8% 36.0% 26.0 26.0% 38.5% 27.5 23.9% 41.8% 30.0 21.4% 46.7% 32.5 19.7% 50.8% 35.0 18.4% 54.3% 37.5 17.4% 57.3% 40.0 16.7% 60.0% 42.5 16.0% 62.4% 45.0 15.5% 64.4%
WARNING! There is no reason to assume that the PE10 won't suddenly drop from far above the median to far, far below the median. Furthermore, there is no reason to assume that, if it does, the PE10 won't stay below the median for a decade or more (as it routinely did before the Roaring Twenties). This is how I rationalize limiting stocks to 85% of the portfolio value: I want a little something to live on while waiting for the stocks to recover their value; however, I am perhaps unrealistically assuming that it won't take decades for them to recover their value to the median level.
Note that there is no reason to assume that a PE10 of 16 will remain the median for centuries to come. It could well be that for the five decades before the Roaring Twenties, investors were too pessimistic or lacked sufficient capital to invest it in the stock market. Nevertheless, it strikes me that theoretically there must be some value for the PE10 at which most investors might expect to make greater gains by investing elsewhere than the stock market. Since I lack the historical data, however, I assume for now that the median will remain near 16.
The following table shows allocation among bond funds to protect against devaluation of principal when interest rates are low and to maximize income when interest rates are high.
To determine which row of this table to use, look up the today's "Daily Treasury Yield Curve Rate" in the "10 Yr" column on the following page: https://www.treasury.gov/resource-center/data-chart-center/interest-rates/Pages/TextView.aspx?data=yield
Ten-Year
Treasury BillShort-term
bond indexTotal bond
market indexLong-term
bond index3.00%
& below100% 0% 0% 4.00% 95% 5% 0% 4.25% 90% 10% 0% 4.50% 80% 20% 0% 4.75% 65% 35% 0% 5.00% 50% 50% 0% 5.25% 35% 65% 0% 5.50% 25% 75% 0% 5.75% 10% 90% 0% 6.00% 0% 100% 0% 6.25% 0% 95% 5% 6.50% 0% 90% 10% 6.75% 0% 85% 15% 7.00% 0% 80% 20% 7.25% 0% 75% 25% 7.50% 0% 65% 35% 7.75% 0% 55% 45% 8.00% 0% 50% 50% 8.25% 0% 45% 55% 8.50% 0% 40% 60% 8.75% 0% 35% 65% 9.00% 0% 30% 70% 9.50% 0% 25% 75% 10.00% 0% 20% 80% 10.50%
& above0% 15% 85%
Vanguard.com offers index mutual funds that have a very low expense ratio. Although there are many choices, you don't need to consider more than a few: